Aethera
Aethera is an interactive artwork and DIY framework that allows participants to explore San Francisco’s environmental health data through sound and light. DIY sensors were built and placed around SF’s various microclimates and neighborhoods to measure light, sound, air quality, UV, temperature, humidity, and particulate pollution. This data was the basis for an interactive 3D visualization and sonification at Gray Area Foundation for the Arts on September 10, 2014. This project would not have been possible without the most hospitable and lovely hosts in SF: Micah, Mark, Nick, Laura, Lois, Stamen Design, Obscura Digital, and Gray Area Foundation for the Arts.
The Aethera project posits digital art as a means to outline human-environmental interactions and their consequences, undelining the relationship between natural and digital clouds. Aethera incorporates the development of an open-source, DIY environmental monitoring system in order to bring about a greater civic awareness towards the often invisible or ignored features of the environments we inhabit.
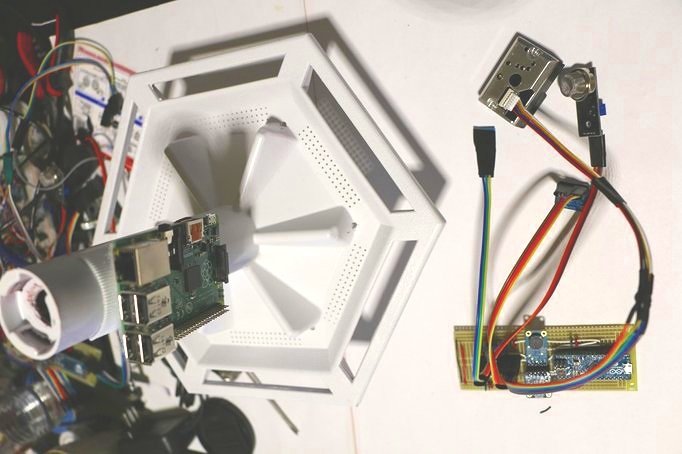
In July 2014, I finished my first prototype of an Aethera Node – a Raspberry Pi and Arduino with sensors housed inside of a recycled bird feeder. The node would capture data and stream it live to a server where I could visualize and sonify the data. I put out a call for hosts on Craigslist.com and within hours found some amazing people around SF who were willing to provide the sensor with power and wifi for 24 hours or more.
This project had three main components. First, the physical sensor, which you can see me build here:
Second, I configured and programmed the raspberry pi using Node.js to send sensor data wirelessly over socket to my Amazon S3 server. The code is here. For those who want to build their own sensor, the Bill of Materials (BOM) is here.
The installation, which premiered on September 10, 2014 at Gray Area Theater, was driven live from an Aethera Node placed inside Gray Area. Participants were able to traverse data sets in real time using an Ipad as an interface. The audio and visual data were constantly evolving.
Here is a sample of the generative audio that emerged from the installation:
Year Produced: 2014
Dimensions: 11"L x 11"W x 9.5"H
Materials: Environmental sensors, recycled composite, single-board computer, microcontroller
Technique: Data visualization, data sonification
Credits: Curation and Support - Gray Area Foundation for the Arts and Obscura Digital
Keywords: Max, OSC, MadMapper, Light Art, Visual Rhythms


